The 5% Coupon: Why a Winning A/B Test Almost Wasn't a Good Idea
Himanshu Manghnani
7/24/20264 min read

"Should we launch this feature to all our customers?"
It sounds like a routine question in a product meeting.
But for a Quick Service Restaurant (QSR) with millions of loyalty members, the wrong answer can mean the difference between improving customer engagement and unintentionally sacrificing profitability.
Imagine you're a data scientist working for a popular coffee chain's loyalty app..
The product team has an idea!
Instead of asking customers to collect 100 loyalty points after every fifth purchase, why not reward them sooner?
Their proposal is simple:
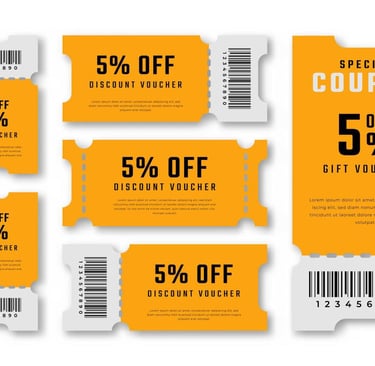
Offer a 5% coupon on the customer's next purchase immediately after their third order.
The thinking is based on a common behavioral principle: customers often respond more positively to immediate rewards than delayed ones. By reducing the waiting time for a benefit, the business hopes customers will return more frequently and strengthen their loyalty.
Marketing loves the idea...(1)
The design team believes customers will appreciate the new experience...(2)
Leadership is eager to roll it out before the holiday season...(3)
But before exposing millions of customers to a new loyalty strategy, one important question needs answering:
Does this feature genuinely improve customer behavior, or does it simply feel like a good idea?
That’s where statistics becomes essential.
Turning an Idea into an Experiment:
Rather than launching the feature to everyone, the analytics team proposes an A/B experiment.
Customers are randomly divided into two groups.
Control Group (A)
Continue using the existing loyalty program.
Earn 100 loyalty points after every fifth purchase.
Treatment Group (B)
Receive a 5% coupon on the next purchase after completing the third order.
Randomization isn't just a technical step - it's the foundation of a trustworthy experiment.
By assigning customers randomly, both groups are expected to have similar purchasing habits, demographics, spending patterns, and visit frequency. If a difference appears later, it's far more likely to be caused by the new reward strategy than by hidden biases in the customer population.
Defining Success Before Looking at the Results:
One of the biggest mistakes in experimentation is deciding what success looks like after seeing the data.
Instead, the team agrees on the evaluation criteria before the experiment even begins.
Primary KPI
Repeat Purchase Rate within 30 days
Secondary KPIs
Average Order Value
Purchase Frequency
Projected Customer Lifetime Value (CLV)
Guardrail Metrics
Coupon Redemption Rate
Promotion Cost per Customer
Gross Margin Percentage
Coupon Abuse or Fraud
Cancellation Rate
These guardrail metrics are just as important as the primary KPI.
A promotion that increases purchases but dramatically reduces margins may generate impressive dashboards while quietly hurting the business.
Designing the Experiment Properly:
Before collecting any data, the analytics team performs a sample size calculation.
Based on historical data, they estimate:
Current repeat purchase rate: 22%
Minimum Detectable Effect (MDE): 1% uplift
Confidence Level: 95%
Statistical Power: 80%
These assumptions indicate that approximately 30,000 customers per group will provide enough statistical evidence to detect a meaningful improvement.
Without enough data, even a genuinely better loyalty program might appear ineffective simply because the experiment lacked sufficient statistical power.
The Results Arrive:
After four weeks, the experiment concludes.
Metric Control Treatment
Customers 30,000 30,000
Repeat Purchase Rate 22.1% 23.4%
An improvement of 1.3 percentage points immediately catches everyone's attention.
The product team is excited & Marketing begins discussing the launch campaign.
But the analytics team asks one more question...! Could this difference simply be random chance?
Enters -> Hypothesis Testing:
Statistics helps answer exactly this question:
The team defines two hypotheses.
Null Hypothesis (H₀)
The new reward strategy has no impact on repeat purchase behaviour.
Alternative Hypothesis (H₁)
The new reward strategy increases repeat purchases.
Using a two-proportion Z-test, they compare the conversion rates between both customer groups.
The result?
z = -3.80, p-value ≈ 0.00015
Since this is below the commonly accepted significance threshold of 0.05, the observed improvement is considered statistically significant.
In other words, there's strong evidence that the improvement is unlikely to have occurred due to random variation alone.
But Statistical significance doesn't guarantee a good business decision
Let's also understand Type I / Type II errors here:
Since the team already built tension around "could this be random chance?" This is the natural spot to name what's actually at stake if the test is wrong in either direction: a Type I error (concluding the coupon works when it doesn't → rolling out a promo that just eats margin) vs. a Type II error (dismissing a genuinely good idea because the test wasn't sensitive enough → walking away from real revenue).
Here's where experienced analysts think differently because the finance dashboard reveals another side of the story.
Coupon redemption increased by 28%
Average promotional cost rose by ₹32 per customer
Gross margin declined by 0.6 percentage points
Suddenly the conversation changes. The question is no longer: "Did the experiment work?"
Instead, it becomes:
"Did the additional customer purchases generate enough long-term value to justify the higher promotional cost?"
This distinction is often overlooked.
A result can be statistically significant without being commercially worthwhile.
Looking Beyond the p-value:
The team also examines the 95% confidence interval.
Rather than saying the uplift is exactly 1.3%, they conclude that the true improvement likely falls between 0.63% and 1.99%.
This range provides leadership with a better understanding of uncertainty and allows finance teams to estimate the best- and worst-case business impact before making a rollout decision. Statistics doesn't eliminate uncertainty: it helps quantify it.
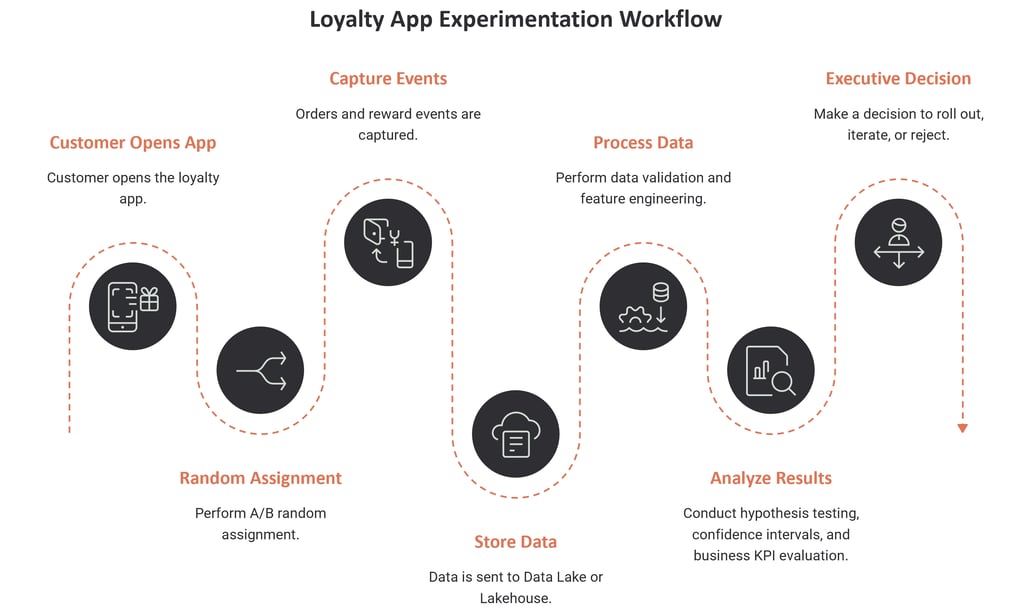
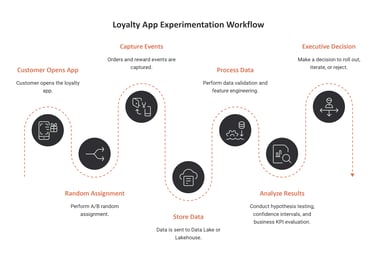
From Customer Clicks to Business Decisions: Behind this seemingly simple loyalty experiment lies an entire analytics pipeline.
Every coupon redeemed, every purchase completed, and every customer interaction contributes to a data-driven decision & not just intuition.
The Final Decision
At the executive review meeting, each stakeholder sees the experiment differently.
The Product Manager celebrates higher engagement.
The Marketing Team sees stronger customer retention.
The Finance Lead raises concerns about declining margins.
The Data Scientist presents the statistical evidence alongside projected Customer Lifetime Value and profitability scenarios.
Only after balancing all four perspectives does leadership approve a phased rollout to a larger customer segment, with continuous monitoring of profitability and customer behavior.
The experiment didn't make the decision; It enabled better decision-making..!
Final Thoughts
Whether it's a loyalty reward in your favorite coffee app, a personalized offer before checkout, or the restaurant recommendations in your food delivery app, chances are those experiences weren't launched because someone thought they were a good idea.
They earned their place through careful experimentation, statistical validation, and measurable business impact.
Every successful product feature begins with a simple question:
"Is this difference real, or are we simply observing random chance?"
Statistics doesn't replace intuition. It ensures that intuition is tested before it reaches millions of customers.